

Blog
Zoho Desk Omnichannel Support: Email, Chat, Social and Phone
Configure Zoho Desk omnichannel support to manage email, live chat, social media, and phone from…
12 min read
Read article →
Zoho Analytics turns data from your CRM, accounting, and support systems into dashboards and reports that help you make decisions. For Indian SMBs that run on Zoho One for Indian SMBs, Zoho Analytics connects to every Zoho app and creates a single reporting layer across sales, finance, and operations.
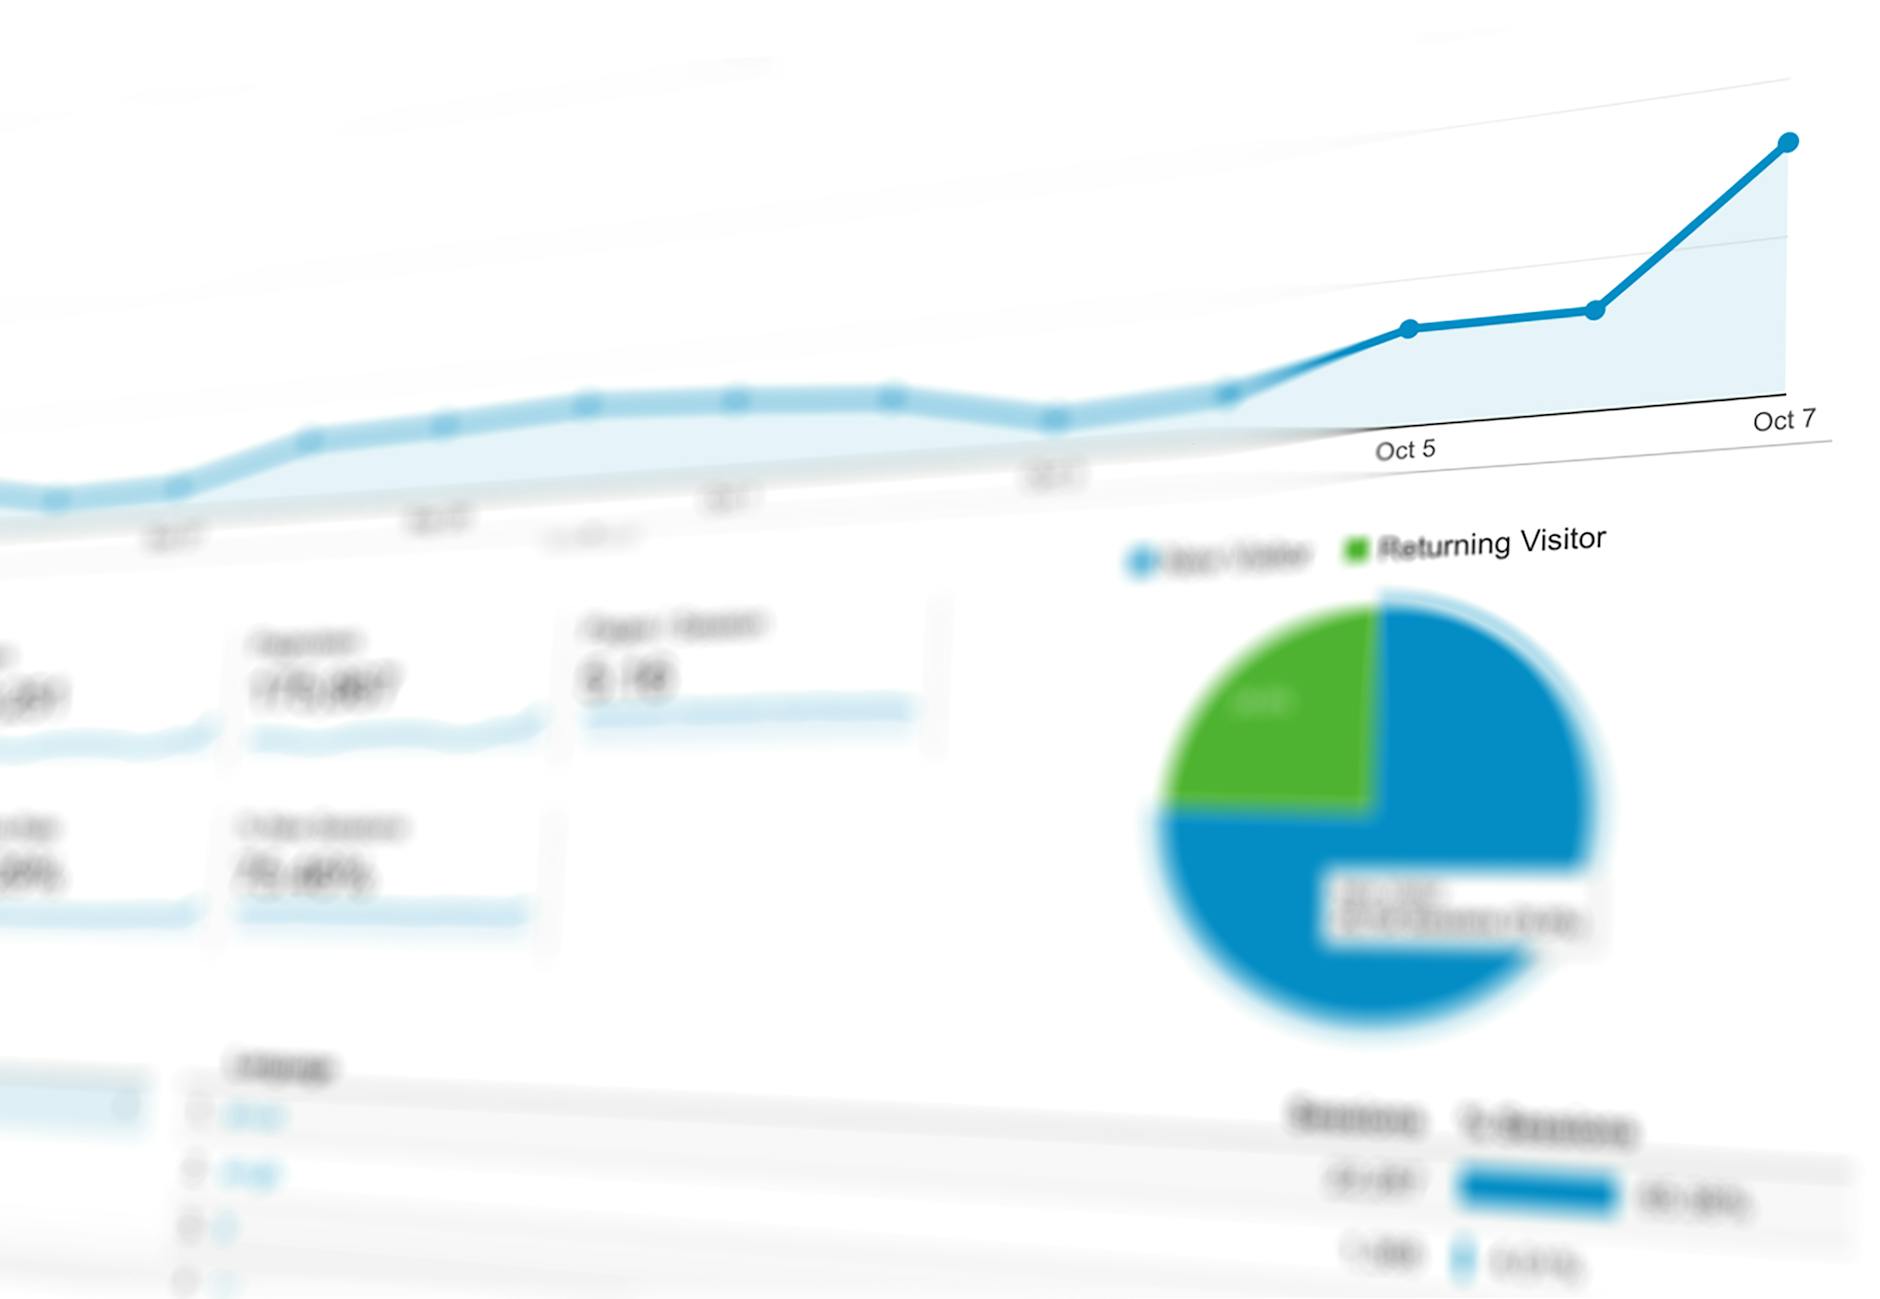
Zoho Analytics is a business intelligence tool that imports data from Zoho CRM, Zoho Books, Zoho Desk, and 250+ external sources (databases, spreadsheets, cloud storage). You build dashboards with drag-and-drop, create custom reports, and share them with your team.
To connect Zoho CRM, the first and most valuable connection for Indian SMBs already on the Zoho ecosystem, go to Import Data > Zoho CRM inside Zoho Analytics. Select the modules you need, such as Leads, Contacts, Deals, and Activities, along with the fields within each. Zoho Analytics creates a workspace from the imported data and sets up a sync schedule, hourly or daily, so reports stay current without manual refreshes. Pairing Zoho CRM with Zoho Books this way lets you build reports that cross pipeline data with actual revenue.
When you connect Zoho CRM to Zoho Analytics, you get pre-built dashboards: sales pipeline overview, deal conversion funnel, revenue by rep, activity metrics, and lead source analysis. Similarly, connecting Zoho Books gives you P&L dashboard, cash flow forecasting using AI and ERP data trends, receivables ageing, and expense breakdown.
To build a dashboard from scratch, click Dashboards > New Dashboard and drag reports from your workspace onto the canvas, resizing and arranging widgets as needed. A useful sales dashboard for management review might combine monthly revenue vs target as a bar chart, deals closed this month by salesperson as a table, top 10 open deals by amount as a table, customer acquisition by city as a map, and a pipeline coverage ratio as a KPI widget.
Drag fields onto the report builder to create pivot tables, charts, and KPI widgets. Common custom reports for Indian businesses:
To build your first report, click Create > New Report. Drag the Deal Stage field to the X-axis and the Deal Amount to the Y-axis for a pipeline stage chart, then add a filter on Closing Date to narrow the view to the current quarter. Zoho Analytics renders the chart in under a second, even for datasets with 100,000+ rows.

The most powerful feature is data blending. Combine CRM deal data with Books invoice data to see which deals are invoiced and paid vs still outstanding. Combine Desk ticket data with CRM accounts to see which customers raise the most support requests relative to their deal value.
To join CRM and Books data at the customer level, open the workspace, select the table you want to join, and use the Lookup Column feature to link records by customer name or GSTIN across the two datasets. Once linked, you can build cross-source reports that pull fields from both, showing which customers the sales team is focused on versus which customers are actually generating revenue this quarter. This level of cross-application reporting is not available in either Zoho CRM or Zoho Books on their own.
Share dashboards with specific users or embed them in portals. Schedule reports to be emailed as PDF every Monday morning. Set up alerts: notify the sales head when weekly pipeline value drops below a threshold.
Dashboards can also be broadcast through a public URL, useful for embedding in an internal tool or displaying on a TV screen in the office, and they refresh automatically on the sync schedule of the underlying data.
Tell us what you are working through and a senior architect from our team will get back to you with a straight answer, usually within a couple of working days. No bot, no hard sell.
A senior architect will get back to you at , usually within a couple of working days. Worth checking your spam folder, just in case.
Configure Zoho Desk omnichannel support to manage email, live chat, social media, and phone from…

On this page Picking the right zoho implementation Zoho implementation and consulting services logistics India…

On this page Getting your zoho recruit ats setup right from the start saves your…
Tell us what you are actually trying to do. You will get a straight answer from a senior architect who has done this before, not a sales rep.
A senior architect will get back to you at , usually within a couple of working days. Worth checking your spam folder, just in case.
Ask it now and a senior architect will get back to you, usually within a couple of working days. It goes to our team, not a mailing list.
A senior architect will get back to you at , usually within a couple of working days. Worth checking your spam folder, just in case.