
Blog
Zoho Certified Partner Benefits and How to Verify Certification
On this page Choosing the right partner for your Zoho deployment is one of the…
11 min read
Read article →
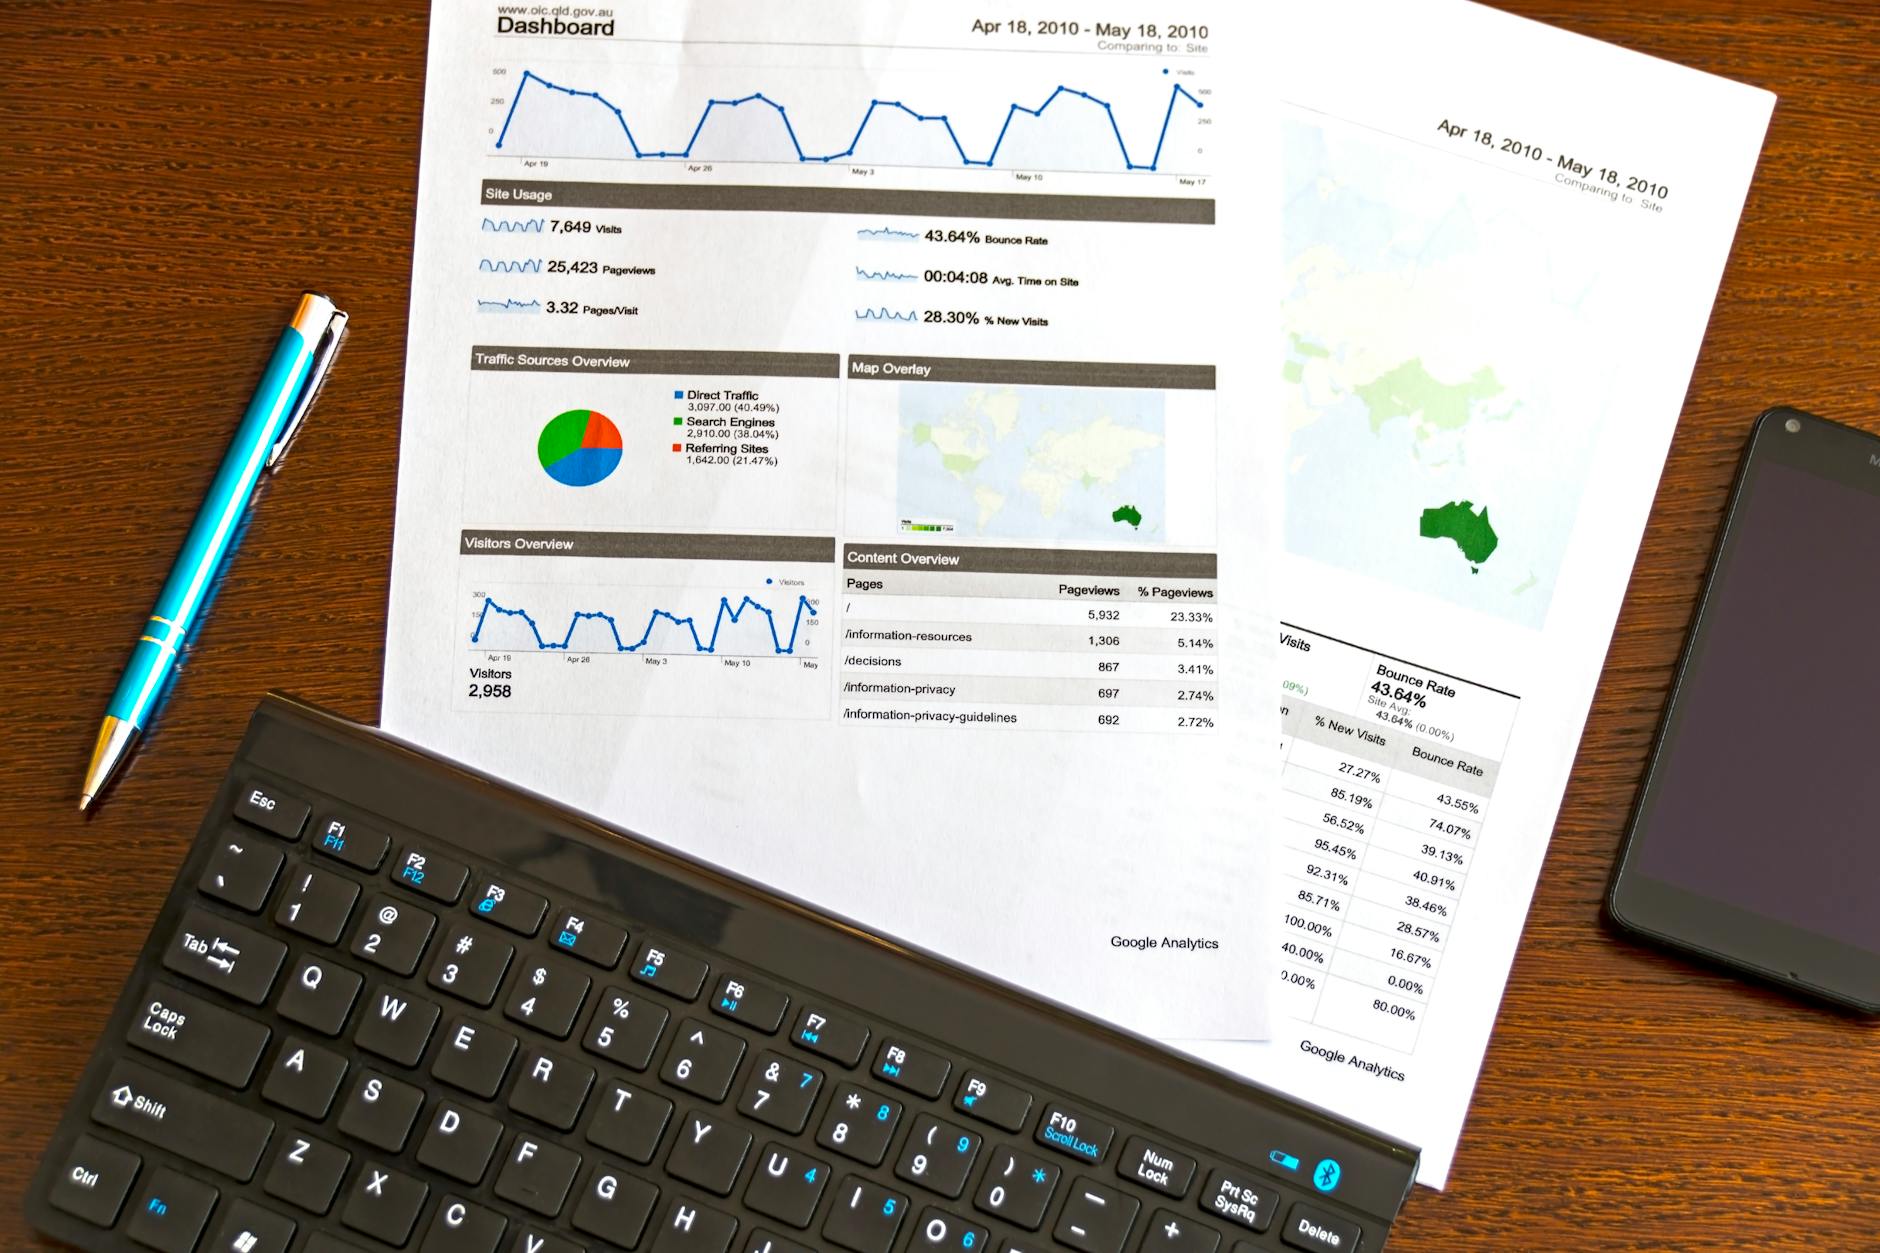
Most businesses have data. Few businesses have answers. Zoho Analytics pulls data from Zoho CRM, Books, Inventory, and other sources into one place and lets you build dashboards and reports that give you real visibility into your business. This guide explains how to set it up and what dashboards to build first.
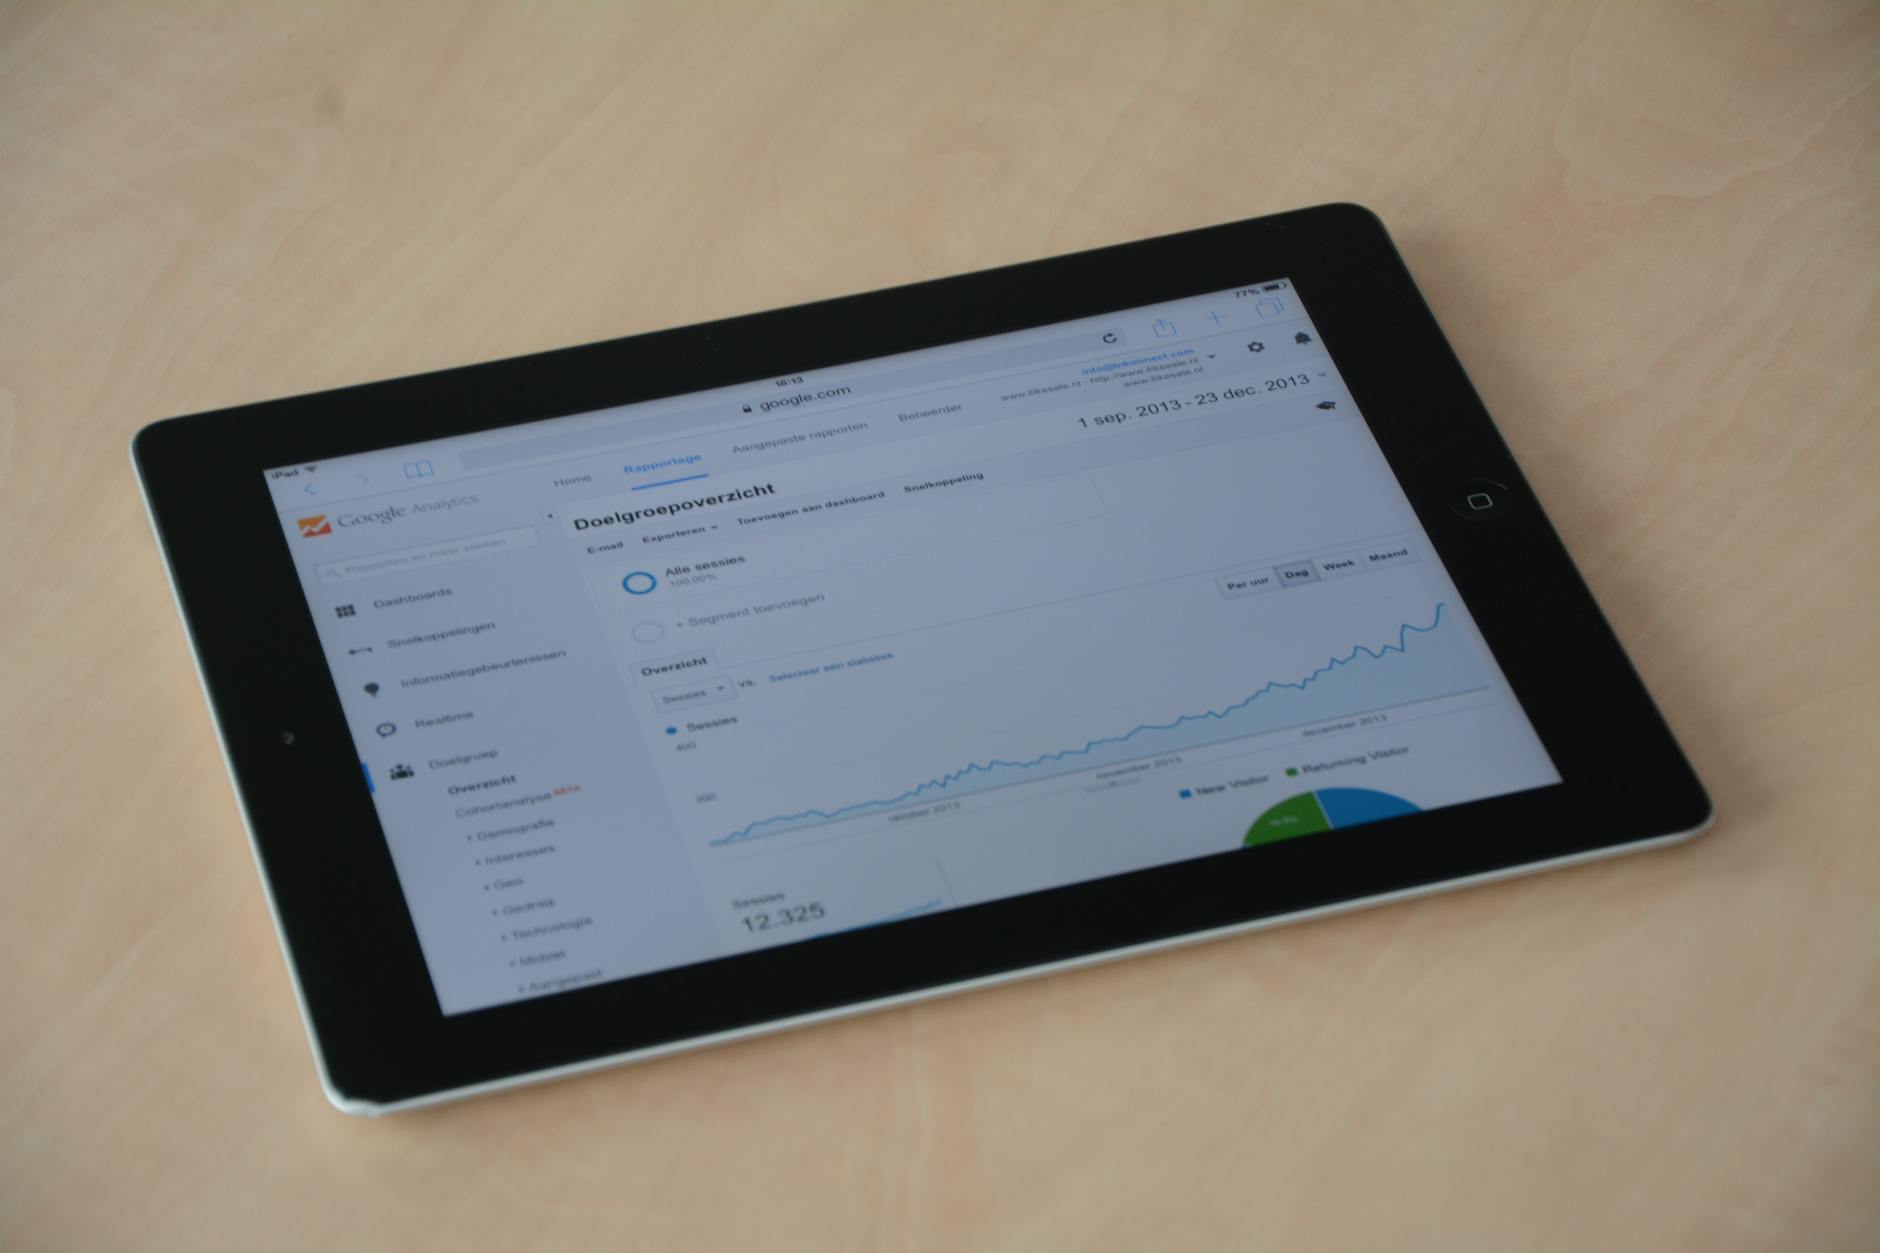
Zoho Analytics is a business intelligence (BI) tool that connects to your Zoho apps and external data sources, combines the data, and lets you build reports, charts, and dashboards without writing SQL or complex formulas. You drag and drop data fields to create Zoho Analytics and Tableau integrationizations.
| Data Source | What You Can Analyze |
|---|---|
| Zoho CRM | Lead Zoho CRM ROI benchmarkss, sales pipeline, rep performance, deal velocity |
| Zoho Books | Revenue, outstanding receivables, expense categories, gross margin, GST summary |
| Zoho Inventory | Stock levels, slow-moving items, purchase costs, warehouse performance |
| Zoho People | Headcount, attrition, leave utilization, department cost |
| Google Ads / Meta Ads | Ad spend vs. lead volume, cost per lead by channel |
| Excel / CSV | Any offline data: competitor benchmarks, market data, field surveys |
| Criteria | Zoho Analytics | Excel from Zoho exports |
|---|---|---|
| Data freshness | Live or hourly sync | As old as last export |
| Multiple data sources | All Zoho apps + external | One export at a time |
| Sharing with team | Browser link, no download needed | Email / shared drive |
| Drill-down | Click on any chart to see detail | Manual filter setup |
| Automation | Scheduled email reports | Manual |
| Formula complexity | Medium (drag-drop UI) | High (VLOOKUP, pivot tables) |
Zoho Analytics Basic is included with Zoho One. The Standard and Premium plans (with more rows and users) require a separate subscription. For most SMEs, the included Basic plan is sufficient to start. Check the Zoho pricing calculator for full plan details.
Yes. Zoho Analytics connects to MySQL, PostgreSQL, MS SQL Server, and other databases via direct connector or scheduled import. This is useful when you have data in a custom system alongside your Zoho apps.
With data already in Zoho, the 5 dashboards above take an experienced Zoho Analytics user approximately 6-10 hours to build correctly. A first-time user should budget 2-3 days with some learning time included. Aaxonix can build these for you as part of a Zoho Zoho implementation checklist engagement.
Yes. Zoho Analytics dashboards can be embedded as iframes in internal portals, Zoho Analytics and Google Analytics 4sites, or shared directly via link with password protection. This is useful for sharing real-time metrics with teams without giving them full Zoho access.
Aaxonix builds Zoho Analytics dashboards for businesses across India. Contact us to discuss setting up analytics for your business.
On this page Choosing the right partner for your Zoho deployment is one of the…

On this page This zoho projects management guide is written for agencies and IT teams…
On this page For Indian D2C brands selling directly to consumers, Zoho CRM + Instamojo…
Our team builds systems that actually work. No fluff, just honest architecture and clean implementation.