Zoho Analytics: Business Intelligence for Indian SMBs
Zoho Analytics turns data from your CRM, accounting, and support systems into Zoho Analytics dashboard building guides and reports that help you make decisions. For Indian SMBs that run on Zoho One for Indian SMBs, Zoho Analytics connects to every Zoho app and creates a single reporting layer across sales, finance, and operations.
What Zoho Analytics Does
Zoho Analytics is a business intelligence tool that imports data from Zoho CRM, Zoho Books, Zoho Desk, and 250+ external sources (databases, spreadsheets, cloud storage). You build dashboards with drag-and-drop, create custom reports, and share them with your team.
Pre-Built Dashboards for Zoho Apps
When you connect Zoho CRM to Zoho Analytics, you get pre-built dashboards: sales pipeline overview, deal conversion funnel, revenue by rep, activity metrics, and lead source analysis. Similarly, connecting Zoho Books gives you P&L dashboard, cash flow forecasting using AI and ERP data trends, receivables ageing, and expense breakdown.
Building Custom Reports
Drag fields onto the report builder to create pivot tables, charts, and KPI widgets. Common custom reports for Indian businesses:
Revenue by product line by quarter (April-March FY)
Customer acquisition cost by lead source
Support ticket resolution time by department
Invoice ageing by customer segment
Sales pipeline weighted forecast vs actual closed revenue
Blending Data Across Apps
The most powerful feature is data blending. Combine CRM deal data with Books invoice data to see which deals are invoiced and paid vs still outstanding. Combine Desk ticket data with CRM accounts to see which customers raise the most support requests relative to their deal value.
Sharing and Scheduling
Share dashboards with specific users or embed them in portals. Schedule reports to be emailed as PDF every Monday morning. Set up alerts: notify the sales head when weekly pipeline value drops below a threshold.
Yes. The version included in Zoho One has limits on rows and data sources compared to standalone plans, but it covers most SMB reporting needs. Upgrade to a higher Analytics plan if you need more data volume.
Can Zoho Analytics connect to non-Zoho data sources?
Yes. It connects to MySQL, PostgreSQL, SQL Server, Google Sheets, Excel files, Salesforce, HubSpot, Google Analytics, and 250+ sources. For Indian businesses using Tally alongside Zoho, export Tally data as CSV and import into Analytics.
Does it support the Indian financial year (April-March)?
Yes. Configure the fiscal year start month in Analytics settings. All date-based reports and filters then align to the April-March year, including quarterly groupings.
Can non-technical users build dashboards?
Yes. The drag-and-drop report builder requires no SQL or coding. Pre-built templates for Zoho CRM and Books give you a starting point that you can customise. Most business users build their first dashboard within 30 minutes.
Connecting Data Sources and Building Your First Report
Zoho Analytics connects to over 50 data sources natively, including Zoho CRM, Zoho Books, Zoho Desk, Zoho Inventory, Google Sheets, MySQL databases, and Salesforce. For Indian SMBs already using the Zoho ecosystem, the most valuable first connection is Zoho CRM combined with Zoho Books, which lets you build reports that cross pipeline data with actual revenue.
To connect Zoho CRM: in Zoho Analytics, click Import Data > Zoho CRM. Select the modules you need (Leads, Contacts, Deals, Activities) and the fields within each. Zoho Analytics creates a workspace with the imported data and sets up a sync schedule (hourly or daily) so reports stay current.
Once data is imported, click Create > New Report to build your first visualisation. Drag the Deal Stage field to the X-axis and the Deal Amount to the Y-axis to get a pipeline stage chart. Add a filter for Closing Date to narrow to the current quarter. Zoho Analytics renders the chart in under a second, even for datasets with 100,000+ rows.
Building Dashboards for Management Review
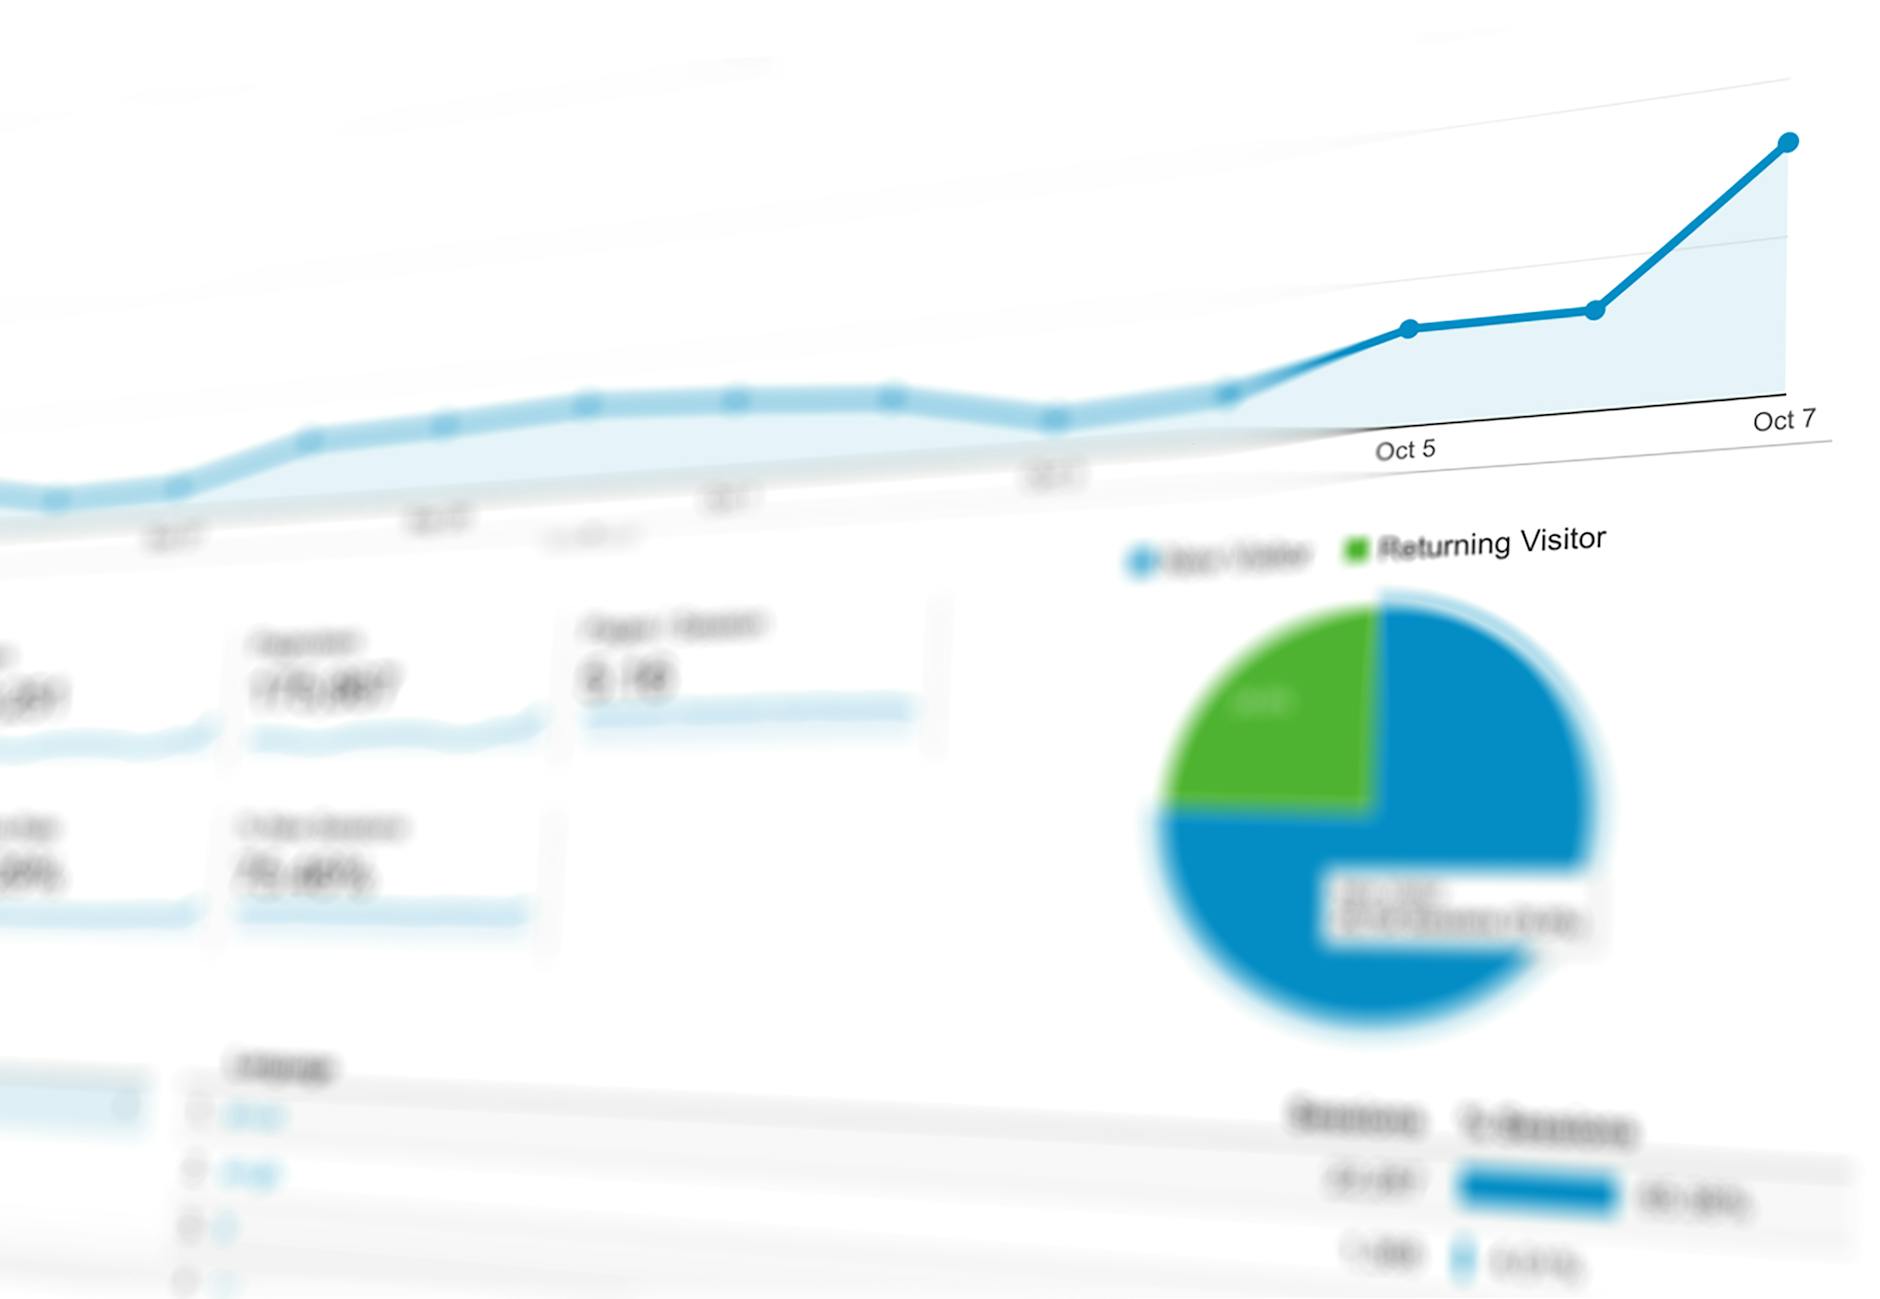
Dashboards in Zoho Analytics are collections of reports and KPI widgets arranged on a single canvas. For Indian businesses, a useful sales dashboard might include: monthly revenue vs target (bar chart), deals closed this month by salesperson (table), top 10 open deals by amount (table), customer acquisition by city (map), and pipeline coverage ratio (KPI widget).
To create a dashboard, click Dashboards > New Dashboard. Add reports from your workspace by dragging them onto the canvas. Resize and arrange widgets as needed. Share the dashboard with specific users or broadcast a public URL to embed it in an internal tool or a TV screen in the office. Dashboards auto-refresh according to the sync schedule of the underlying data.
Joining Zoho Books and Zoho CRM Data
One of the most powerful capabilities in Zoho Analytics is joining data from different Zoho applications. A common use case for Indian B2B companies is comparing sales pipeline (from CRM) with actual invoiced revenue (from Zoho Books) at the customer level. This shows you which customers the sales team is focused on versus which customers are actually generating revenue this quarter.
To join these datasets, go to the workspace, click the table you want to join, and use the Lookup Column feature to link customer name or GSTIN across the CRM and Books datasets. Once linked, you can create cross-source reports that pull fields from both. This level of cross-application reporting is not available in either Zoho CRM or Zoho Books on their own.
Frequently Asked Questions
Does Zoho Analytics support scheduled email reports?
Yes. You can schedule any report or dashboard in Zoho Analytics to be emailed to specified recipients at a set frequency (daily, weekly, monthly). The email contains a snapshot of the report at the time it runs. This is useful for sending weekly sales summaries to the management team or daily cash position reports to the CFO without them needing to log in.
Can Zoho Analytics handle Excel and Google Sheets data?
Yes. Zoho Analytics can import Excel files, Google Sheets, and CSV files directly. You can upload a one-time file or set up a sync so that changes in the Google Sheet are reflected in Zoho Analytics at a defined interval. This is useful for businesses that have not yet moved all their data to Zoho applications but still want to build consolidated reports.
How does Zoho Analytics pricing work for Indian businesses?
Zoho Analytics pricing is based on the number of users and rows of data. The Basic plan starts at Rs 24,000 per year for 2 users and 500,000 rows. The Standard plan at Rs 60,000 per year covers 5 users and 5 million rows. For most Indian SMBs using Zoho CRM and Zoho Books, the Basic or Standard plan is sufficient. Data synced from Zoho applications does not count against the row limit.