

Blog
CRM Data Cleanup Before Migration: How to Prepare Your Records for a Clean Start
Step-by-step guide to CRM data cleanup before migration. Covers deduplication, field mapping, format standardisation, and…
15 min read
Read article →
NetSuite reporting and dashboards are the primary reason many finance and operations teams choose the platform over standalone ERP tools. Built natively into the system, the SuiteAnalytics stack gives every role, from a CFO scanning cash positions to a warehouse manager tracking open purchase orders, a real-time view of the data that matters to them. This guide covers how each layer of the stack works, how to configure it correctly, and the common mistakes that cause organisations to underuse it.

SuiteAnalytics is the umbrella term for NetSuite’s built-in reporting and analytics toolset. It is not a separate product or add-on: it is part of every NetSuite subscription and operates directly on the same transactional database the ERP uses for processing. There is no ETL pipeline, no data warehouse lag, and no synchronisation window. When a sales order is closed or an invoice is posted, that data is available to every report and dashboard instantly.
The stack has four distinct layers:
Each layer is designed for a different user profile. Saved searches suit power users who need precise, filterable data. Standard reports meet statutory and audit requirements. Dashboards drive daily operational awareness. Workbooks support analytical exploration without requiring SQL or scripting knowledge. Understanding which tool to use, and when, is the starting point for getting real value out of NetSuite financial management at the reporting layer.
A NetSuite dashboard is a configurable home screen assigned to a user role. When a user logs in, they land on the dashboard for their primary role. The key architectural point is that dashboards are role-level objects by default: a single administrator can configure one dashboard and publish it to every user in that role. Individual users can then personalise their own view without overwriting the shared baseline.
Portlets are the modular units that populate a dashboard. The most useful portlet types are:
Common dashboard configurations include an Accounts Receivable dashboard showing overdue invoice counts, DSO trend, and a saved search of invoices past due by 30/60/90 days; and an Operations dashboard showing open sales orders by fulfilment status, warehouse pick queue, and stock-level alerts by location. Getting these configurations right from the outset is one of the highest-value activities in any NetSuite implementation and configuration engagement.
The netsuite kpi dashboard setup process requires defining KPI metrics before surfacing them. Go to Lists > Dashboards > Key Performance Indicators. Each KPI is built on either a saved search aggregate (e.g., sum of invoice amount where status = Overdue) or a standard report value (e.g., Net Revenue from the P&L). Period comparison is configured per KPI: you can compare current period to prior period, prior year, or a custom date range. Once KPIs are saved, they appear in the KPI Scorecard portlet selector.
NetSuite saved searches are the most flexible and widely used reporting tool in the platform. They work by querying the NetSuite record model, not a separate reporting layer, so every field on every record type (transactions, entities, items, custom records) is queryable. The netsuite saved searches feature supports filter criteria, multi-level joins, formula fields using NetSuite’s expression syntax, and result set aggregation (sum, count, average, min, max).
Saved searches become dynamic reports when shared across roles. A saved search set to “Available as List View” appears in the relevant record list. A search set to “Available as Sublist View” appears on individual record pages. Saved searches can also be emailed on a schedule, exported to CSV, or rendered as charts, column, bar, line, pie or area, by configuring the Chart tab within the search definition.
For netsuite custom reports that require cross-join logic not achievable with a single record type, saved searches support joined subrecords. For example, an Item search can pull joined Transaction data to show sales volume by SKU and period in a single result set.
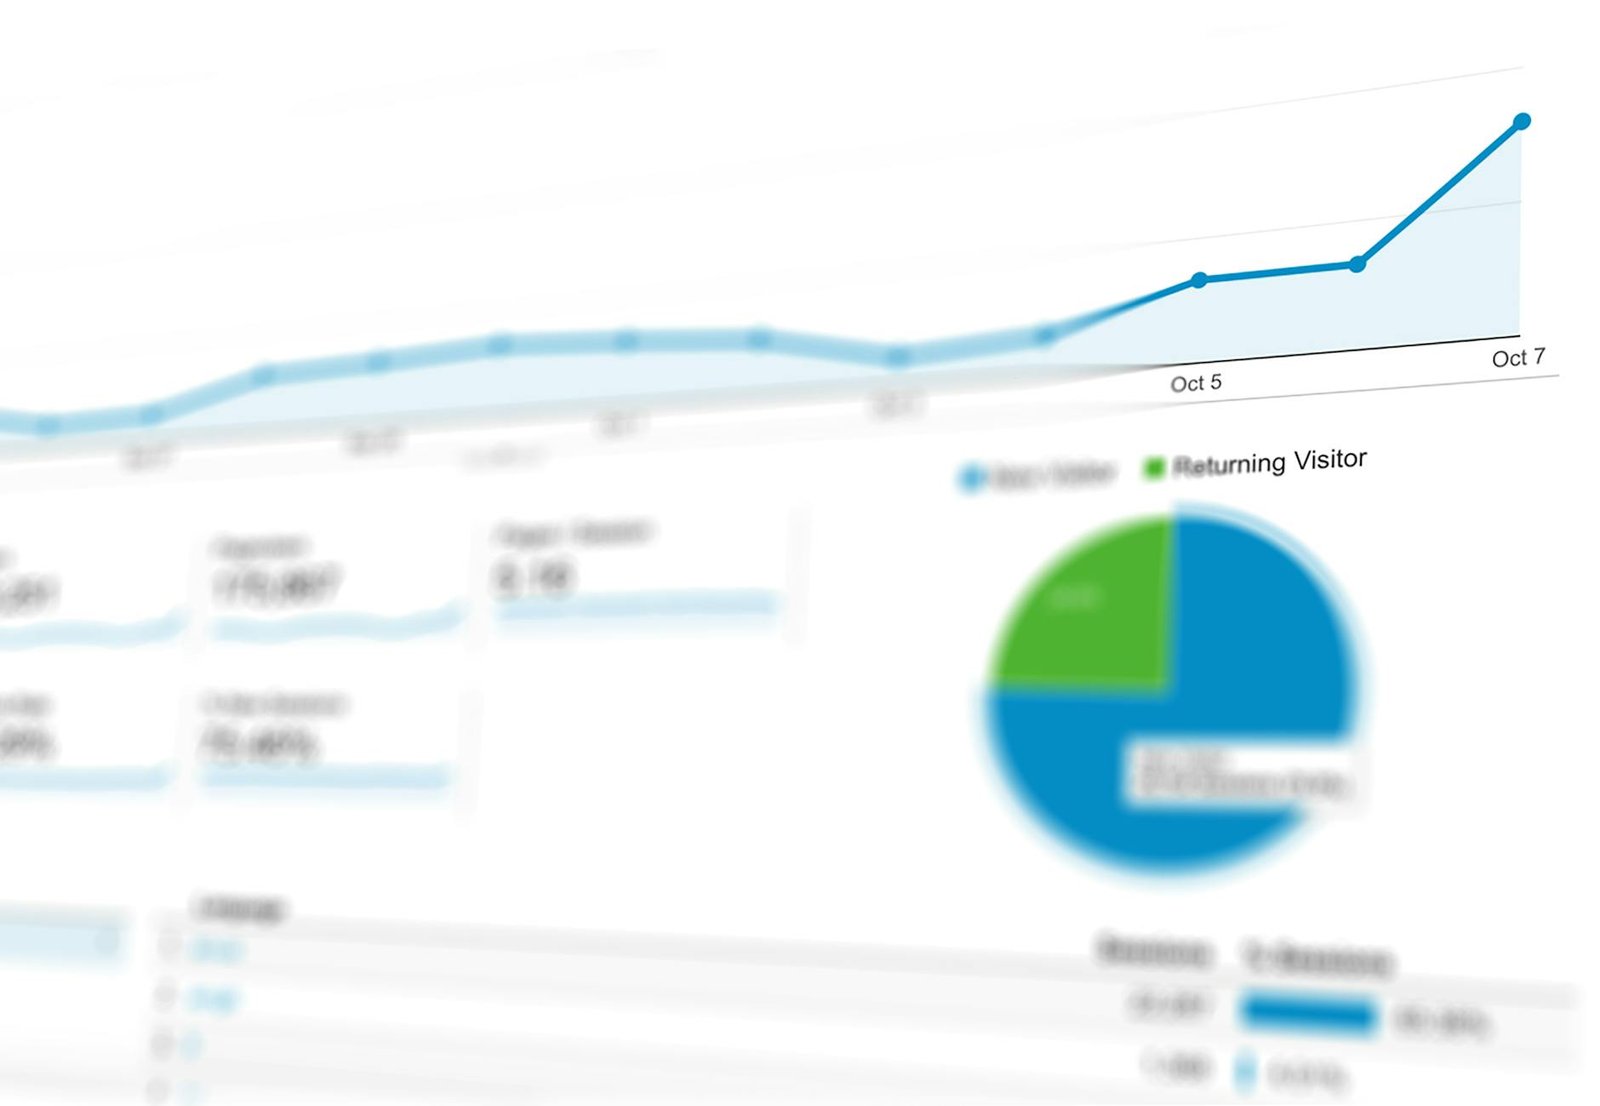
SuiteAnalytics Workbooks were introduced as the next-generation analytics layer for users who need exploratory analysis without writing SuiteScript. The workbook environment has three components: the Dataset Builder, the Pivot Table editor, and the Chart editor.
A dataset is the equivalent of a named query. You select a root record type, then add joined record types as needed, select fields, and apply filters. Datasets are reusable: multiple workbooks can reference the same dataset. The dataset builder uses a visual field selector rather than SQL syntax, making it accessible to analysts without a technical background.
Once a dataset is defined, the pivot table editor allows you to drag dimensions to rows and columns, and measures (numeric fields or formula aggregates) to the values area. This is functionally similar to Excel pivot tables, but the data source is live NetSuite transaction data. A common use case: revenue by subsidiary and month for the current fiscal year, with a comparison column for the prior year, built in under five minutes from an existing Transaction dataset.
The chart editor in Workbooks supports bar, line, area, scatter and combination charts. Charts are linked to pivot table configurations: changing the pivot updates the chart. Workbooks also support multiple charts per workbook, which can be pinned to dashboards as Report Snapshot portlets.
Workbooks do not replace saved searches for operational filtering tasks, and they do not replace standard financial reports for statutory outputs. Their value is in analytical exploration: trend analysis, variance investigation, and building internal management packs that are updated automatically each time the workbook is opened.
NetSuite’s standard financial reports are generated from the General Ledger and require no configuration to produce basic outputs. The core reports, Profit and Loss, Balance Sheet, Cash Flow Statement, Trial Balance and General Ledger Detail, are accessible under Reports > Financial.
Each financial report accepts a set of parameters before rendering:
The netsuite custom reports engine for financial statements uses the Financial Report Builder (Reports > Financial > Financial Report Builder). This tool allows you to define custom row groupings, for example, grouping specific accounts under a custom subtotal header, and custom column layouts. Useful when the default P&L layout does not match your management reporting structure. Row definitions can include formula rows that calculate ratios (e.g., Gross Margin %) directly within the report output.
For organisations with statutory requirements across multiple jurisdictions, the NetSuite financial reporting for Indian businesses configuration, including GST-compliant transaction mapping and period-close schedules, follows the same Financial Report Builder logic but with subsidiary-level account segment filtering applied.
NetSuite supports multiple budget scenarios per fiscal year. Budgets are entered at the account and period level (Lists > Accounting > Budgets) and are available as comparison columns in any financial report. Combined with AI-driven cash flow forecasting tools that integrate with NetSuite’s actuals data, this gives finance teams both a backward-looking variance report and a forward-looking projection in a single workflow.
NetSuite reports and saved searches can be delivered automatically without requiring users to log in and run them manually. The scheduling options are different for saved searches and standard reports.
Open any saved search and go to the Email tab. You can configure:
Conditional sending is particularly useful for exception reports. An overdue invoice search set to “send only if results exist” will remain silent on weeks with no overdue items, eliminating alert fatigue.
Standard reports use a separate mechanism. From the report output page, click Schedule and configure the delivery. Standard reports deliver as PDF or CSV attachments. Note that the scheduling engine for standard reports runs at a fixed server-side window, typically within a few hours of the configured time, rather than at an exact clock time.
SuiteAnalytics Workbooks are shared by setting the audience on the workbook definition. You can assign workbooks to specific roles, which makes them appear in the Analytics tab for those users. Workbooks do not currently support external email delivery: they are for internal NetSuite users only.

What is the difference between a saved search and a SuiteAnalytics Workbook?
A saved search queries a single primary record type with optional joins and returns a flat list or aggregated table. It is best suited for operational filters, reminders and scheduled email delivery. A SuiteAnalytics Workbook uses a dataset, a broader multi-record query, and provides a pivot table and charting environment for exploratory analysis. Workbooks do not support scheduled email delivery but are better for management pack-style analysis.
Can NetSuite dashboards be different for users in the same role?
Yes. A role has a published default dashboard that all members start with, but individual users can personalise their own view by adding, removing or repositioning portlets. Their personal customisations override the role default for their session only and do not affect other users in the same role.
How do I add a budget comparison column to a NetSuite P&L report?
Open the P&L report under Reports > Financial > Income Statement. Click Customise and go to the Columns section. Add a Budget column and select the budget scenario you want to compare against. You can also add a Variance column (Actual minus Budget) and a Variance % column. Save the customised report to reuse these settings without reconfiguring each time.
What permissions are required to create saved searches?
Users need the “Perform Search” permission at the Create level to build saved searches, and “Publish Search” permission to make them available to other users or roles. These permissions are set under Setup > User Management > Roles > [Role] > Reports/Search permissions.
Does NetSuite netsuite suiteanalytics support real-time data?
Yes. SuiteAnalytics, including saved searches, standard reports and workbooks, queries the live NetSuite database directly. There is no data warehouse or replication delay. The only exception is Report Snapshot portlets on dashboards, which cache at a configurable interval (minimum 15 minutes) to reduce dashboard load times.
Can I export NetSuite reports to Excel?
Yes. Standard financial reports can be exported to Excel (.xlsx) or CSV from the report output page using the Export button. Saved search results export to CSV directly. SuiteAnalytics Workbook pivot tables can be exported to CSV. For formatted Excel output with merged cells and custom headers, some organisations use SuiteScript or third-party connectors to push data into Excel templates.
Getting full value from NetSuite reporting and dashboards requires the right configuration from day one. Aaxonix helps finance and operations teams build role-specific dashboards, saved search libraries and workbook templates that surface the metrics your business actually runs on.
Book a free consultationNetSuite reporting and dashboards work best when each layer, saved searches, standard financial reports, workbooks and role dashboards, is used for the task it was designed for. The most common failure mode is not a lack of capability but a configuration gap: dashboards that were never set up, saved searches that were never shared, and financial reports that are run manually when they could be scheduled automatically. Closing those gaps converts the platform from a transaction system into an active management tool that gives every role the information they need without waiting for a finance team member to produce a manual spreadsheet.
Tell us what you are working through and a senior architect from our team will get back to you with a straight answer, usually within a couple of working days. No bot, no hard sell.
A senior architect will get back to you at , usually within a couple of working days. Worth checking your spam folder, just in case.
Step-by-step guide to CRM data cleanup before migration. Covers deduplication, field mapping, format standardisation, and…

How NetSuite for healthcare unifies clinical ops, revenue cycle billing, and HIPAA compliance. A guide…

Most companies underestimate their SaaS stack cost by 40-80%. Learn how per-user pricing compounds, where…
Tell us what you are actually trying to do. You will get a straight answer from a senior architect who has done this before, not a sales rep.
A senior architect will get back to you at , usually within a couple of working days. Worth checking your spam folder, just in case.
Ask it now and a senior architect will get back to you, usually within a couple of working days. It goes to our team, not a mailing list.
A senior architect will get back to you at , usually within a couple of working days. Worth checking your spam folder, just in case.